Six Ways The US Tax Code Is Made For The Rich

The Article: Six Charts That Prove The Tax Code Was Written For The Rich by Walter Hickey in Business Insider.
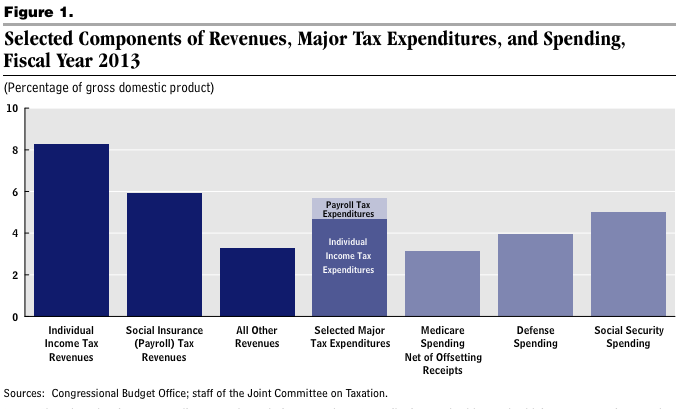
The Text: There’s an outstanding new report from the Congressional Budget Office analyzing which income sectors receive the most benefits from tax expenditures.
One thing is completely obvious after the report: The U.S. tax code is designed to turn the screws on the middle class, while granting huge tax breaks to the rich and and tax credits to the lowest income quintile.
The CBO calls these “tax expenditures” because “they resemble federal spending by providing financial assistance to specific activities, entities, or groups of people. Tax expenditures, like traditional forms of federal spending, contribute to the federal budget deficit.”
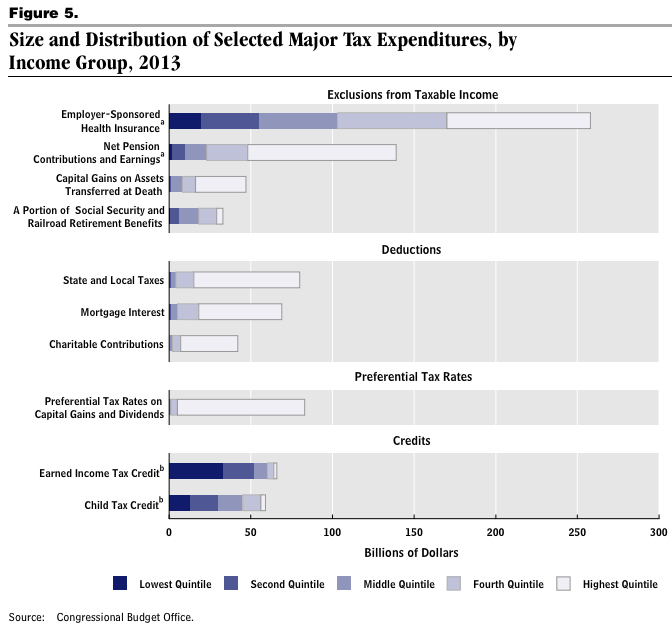
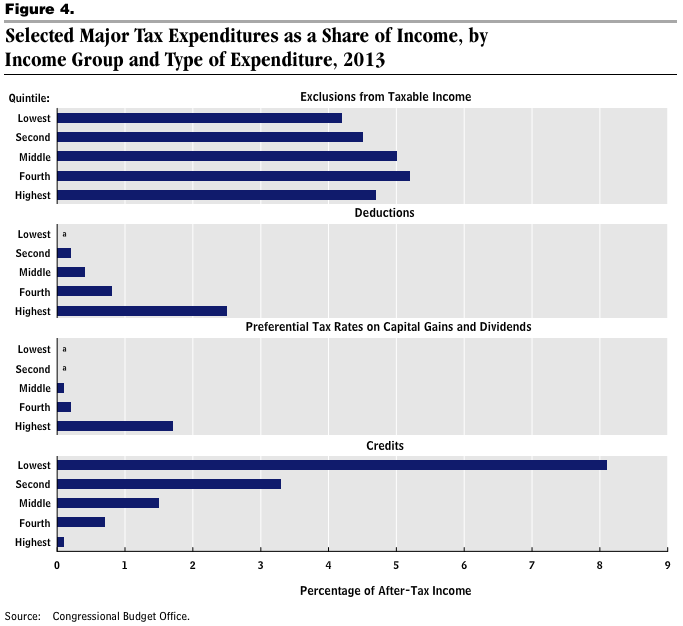
The report looked at four kinds of tax expenditures:
Exclusions from taxable income – Roughly evenly distributed among the quintiles.
Deductions – Benefits of itemized deductions “rise sharply with income,” benefiting the rich the most.
Preferential tax rates – The low tax rates on dividends and capital gains “provide almost no benefits to households in the bottom four quintiles” but are a huge benefit to the upper fifth.
Tax credits – The credits provide large benefits to households in the lowest income quintile by design, with decreasing upward benefits.
Notice how none of those are really targeted at the middle three quintiles? Check out the charts to see just how bad it is.
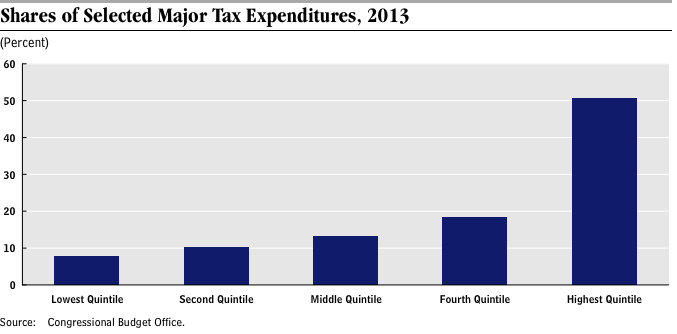
Here’s the share of who benefits the most from the U.S. tax code’s expenditures. In 2013, half of the combined benefits of the tax expenditures analyzed in the report will accrue to the top fifth of households:
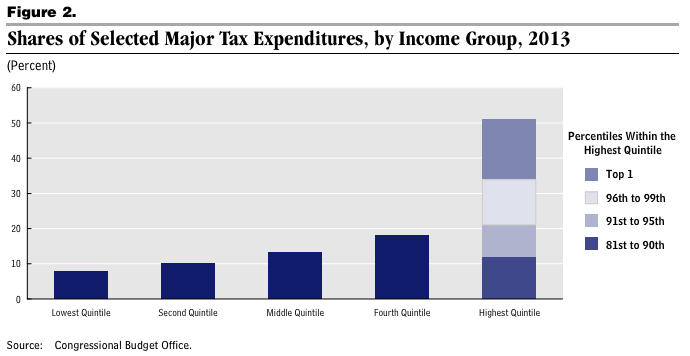
This is another look at that chart, with the bar for the highest quintile broken down further. The top 1% benefits from tax expenditures more than any of the other four quintiles.
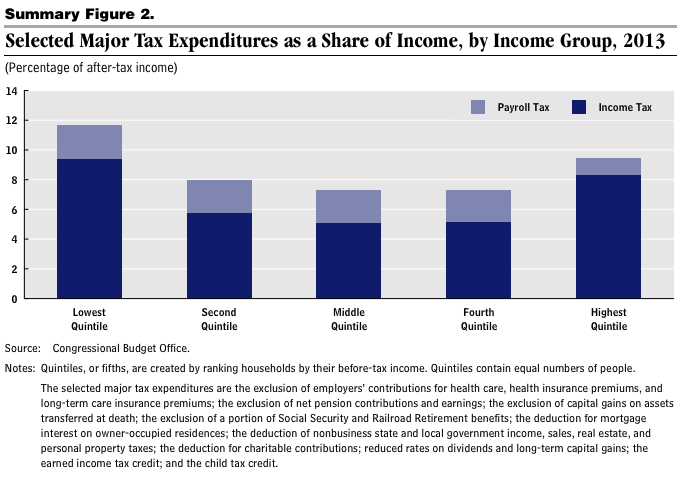
Here’s what it looks like measured relative to after-tax income. The analyzed expenditures are largest for the lowest and highest quintile. If you’re in the middle three quintiles, you perceive the most pain:
The money that taxpayers don’t pay to the government in expenditures is huge. The ten expenditures analyzed in the report, taken together, would equal about a third of federal revenues.
Here we take a look at who benefits from what. Everyone benefits from exclusions from taxable income. Deductions become much, much more meaningful as you get richer. Capital Gains is really only meaningful for the top quintile, and tax credits are designed for the poorest quintile.
These are the ten expenditures that the report analyzed specifically. Notice how most of these, besides the Employer-sponsored health insurance exclusion, the child tax credit and the pension exclusion are pretty meaningless for the middle class.